LandPKS Learning
Knowledge Hub
Soil Mapping Scale and Information Uncertainty
One of the major benefits of soil classification systems is the fact that soil classes, when correlated to the biophysical properties of the landscape, can be mapped with relative accuracy.
Soil classes function as information carriers, providing land managers with information to address different management problems.
In the U.S., soil classes have been mapped across the country at various levels of detail, but typically at map scales between 1:24,000 and 1:64,000. These map scales mean that every centimeter on a map translates to 24,000 or 64,000 centimeters on the ground.
The top panel of Figure 1 gives a visual example of this with the top map rendered at a scale of 1:24,000. Note how you can easily discern both roads and buildings. At this scale, the smallest mappable area is roughly 1 ha (~2.5 acres). In contrast to this, global soil maps such as the Harmonized World Soil Database (HWSD) are typically mapped at a much smaller map scale (~1:1,000,000).
Figure 1, bottom panel, illustrates this difference in scale by showing the same general area as the top panel but at a map scale of 1:1,000,000. Roads and houses are no longer discernible at this scale and only major geographic features such as mountains, rivers and urban centers are easily identified. At this smaller map scale the smallest mappable area is roughly 4000 ha (~10,000 acres). This represents a significant decrease in the spatial resolution of our soil maps, resulting in less reliable information to end-users.
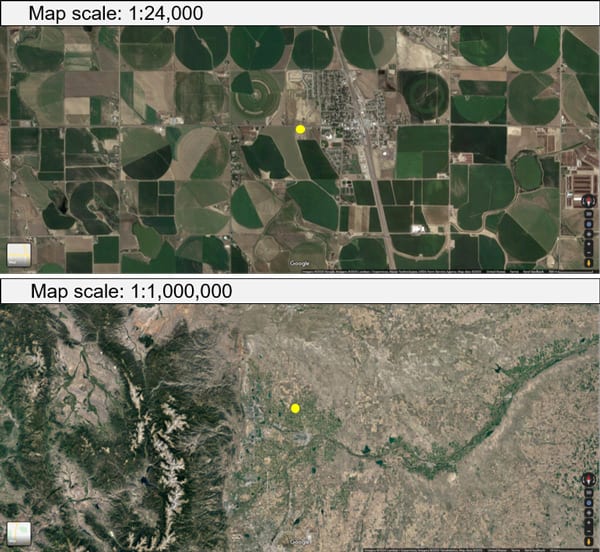
Figure 1
Mapping scale can cause information uncertainty in two different ways:
- Uncertainty about Soil Map Units (SMU). That is, are the boundaries separating SMUs accurately drawn on the map?
- Uncertainty about where individual soil components are located within the SMU.
The first relates to the spatial uncertainty inherent within the soil map. The second source of spatial uncertainty relates to data completeness. In other words, how complete and/or accurate are the lists of soil components for each SMU? While in most cases the soil components that cover the largest area within a SMU (i.e., dominant components) will be accurately listed, those components covering only small areas (i.e., minor components) may not be listed at all (Type 2 error or error of omission).
The mapping scale affects the likelihood of these Type 2 errors. At large map scales (e.g., 1:24,000) we can assume that these Type 2 errors will be lower due to the smaller mapping area (>=1 ha) and potentially lower soil variability allowing a more complete characterization. At smaller mapping scales (e.g., 1:1,000,000) each SMU encompasses a much greater area ((>=4,000 ha) with higher soil variability resulting in more soil classes. Coarse scale mapping efforts (i.e., small map scales) are not capable of fully documenting this variability resulting in higher Type 2 errors for minor soil components.
Download a printable copy of this article.


Jornada Experimental Range
Range Management Research Unit
2995 Knox St.
Las Cruces, NM 88003-0003, USA
Mobile App | Data Portal | Knowledge Hub | Habitat Hub | Learning Collections | Blog | About | Contact | Support